skip to main
|
skip to sidebar
Pages
Home
Antarctica Seafloor Map
Antarctica--Special Interest Areas/Geology
Bird Evolution
Bird Family Tree
Geological Timeline
Saturday, December 24, 2011
Merry Christmas from Penguinology!
Wishing that all your dreams will come true this year at Christms!
~~~wiinterrr
No comments:
Post a Comment
Newer Post
Older Post
Home
Subscribe to:
Post Comments (Atom)
Get
Follow Me Buttons
Search This Blog
EarthGuide-Penguins
AAD Antarctic species page
Animal Diversity Web
Archaeopteryx, Ancient Birds, Dino-Bird Relationships
Arkive info/images of all life on earth
Center for Biological Diversity-Penguins
Dinosauria Online
Dyan deNapoli (the penguin lady)
EarthGuide--Penguins
Gentoo Penguins at O'Higgins Station, Antarctica
Global Penguin Society *new*
Hedwig's Penguin Info Page (A++)
Herperornis regalis
Ice Stories
Map of Antarctica
March of the Penguins
Nature-Penguins of the Antarctic
Nature-The World of Penguins
New Zealand Ecology-Penguins
Penguin News
Penguin Rookeries Location
Penguin Science
Penguin Studies (Dr. Boersma's Site)
Penguin Watch
Penguin World
Postcards from the Poles
Spot the Penguin
The Penguin Page
The Tourist Trail
Penguins
Wallace Line
Zoogeographical Areas w/ approx. boundaries
(Newton and Dale 2001)
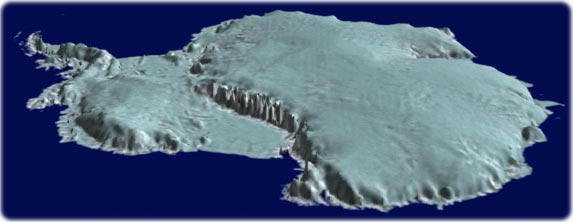
Antarctica
Antarctica ~~ side view
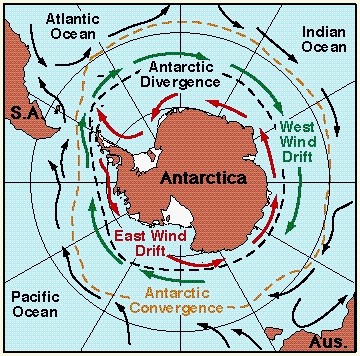
Antarctic Convergence/Divergence Zone
Source: http://www.jochemnet.de/fiu/OCB3043_18.html
Plate Tectonics
McMurdo Date & Time
McMurdo Wx Conditions
New McMurdo Base LiveCam
South Pole Date & Time
South Pole Wx Conditions
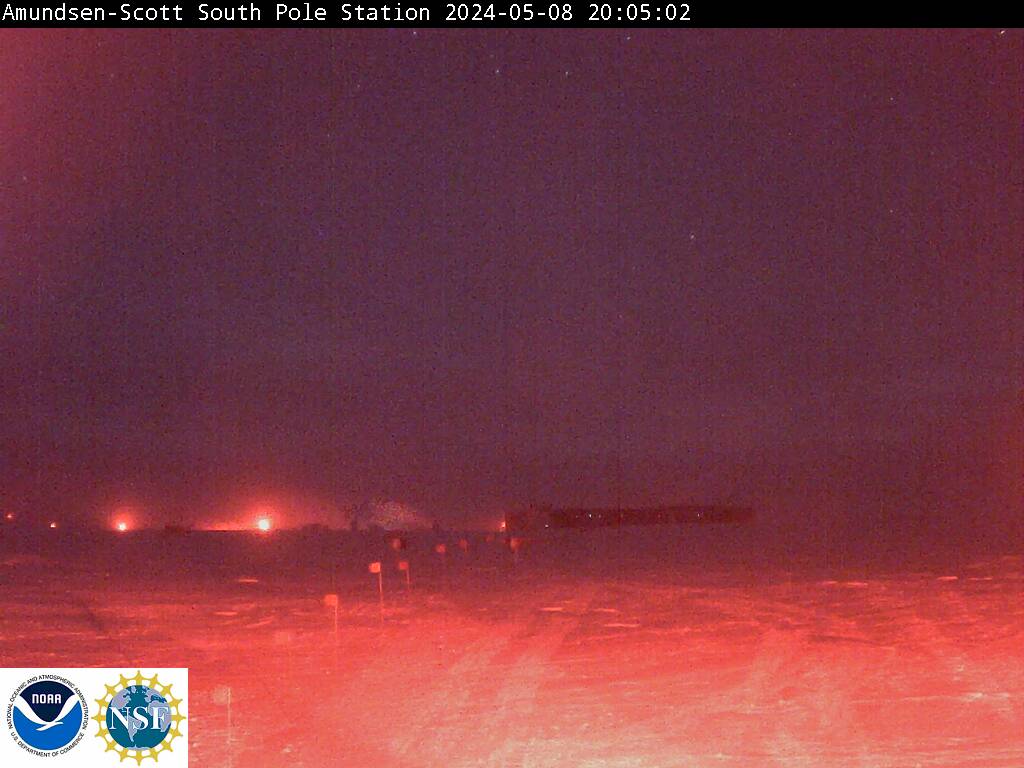
South Pole Live Cam
My Blog List
Penguin Ranch
Photos From Kozue
17 years ago
Welcome-See yourself here?
Visitor Count
hit counter
Blog Archive
►
2017
(7)
►
April
(2)
►
February
(4)
►
January
(1)
►
2016
(34)
►
October
(2)
►
September
(2)
►
August
(2)
►
July
(4)
►
June
(2)
►
May
(2)
►
April
(2)
►
March
(5)
►
February
(10)
►
January
(3)
►
2015
(40)
►
December
(9)
►
November
(6)
►
October
(8)
►
September
(1)
►
August
(2)
►
July
(1)
►
June
(2)
►
May
(2)
►
April
(2)
►
March
(4)
►
February
(2)
►
January
(1)
►
2014
(71)
►
December
(6)
►
November
(5)
►
October
(7)
►
September
(4)
►
August
(7)
►
July
(12)
►
June
(11)
►
May
(6)
►
April
(3)
►
March
(3)
►
February
(4)
►
January
(3)
►
2013
(51)
►
December
(3)
►
November
(3)
►
October
(3)
►
September
(6)
►
August
(4)
►
July
(2)
►
June
(3)
►
May
(4)
►
April
(3)
►
March
(6)
►
February
(5)
►
January
(9)
►
2012
(58)
►
December
(3)
►
November
(9)
►
October
(5)
►
September
(5)
►
August
(4)
►
July
(7)
►
June
(4)
►
May
(4)
►
April
(4)
►
March
(5)
►
February
(7)
►
January
(1)
▼
2011
(59)
▼
December
(9)
Happy New Year! from Penguinology
Dino-Chicken???
Merry Christmas from Penguinology!
Do penguins communicate under water?
Dinosaurs With Killer Claws Yield New Theory About...
100 years on, Antarctic science going strong
Seabirds: Climate Differences Have Less Impact On ...
Antarctic study digs for clues to penguin past
How penguins 'time' a deep dive
►
November
(1)
►
October
(2)
►
September
(8)
►
August
(1)
►
July
(6)
►
June
(5)
►
May
(5)
►
April
(5)
►
March
(4)
►
February
(6)
►
January
(7)
►
2010
(56)
►
December
(3)
►
November
(3)
►
October
(3)
►
September
(4)
►
August
(7)
►
July
(9)
►
June
(2)
►
May
(7)
►
April
(5)
►
March
(3)
►
February
(4)
►
January
(6)
►
2009
(116)
►
December
(2)
►
November
(4)
►
October
(2)
►
September
(3)
►
July
(6)
►
June
(8)
►
May
(13)
►
April
(13)
►
March
(19)
►
February
(17)
►
January
(29)
►
2008
(174)
►
December
(42)
►
November
(43)
►
October
(44)
►
September
(26)
►
August
(2)
►
July
(5)
►
June
(6)
►
May
(6)
Followers


No comments:
Post a Comment